CHS gets a report card of its own
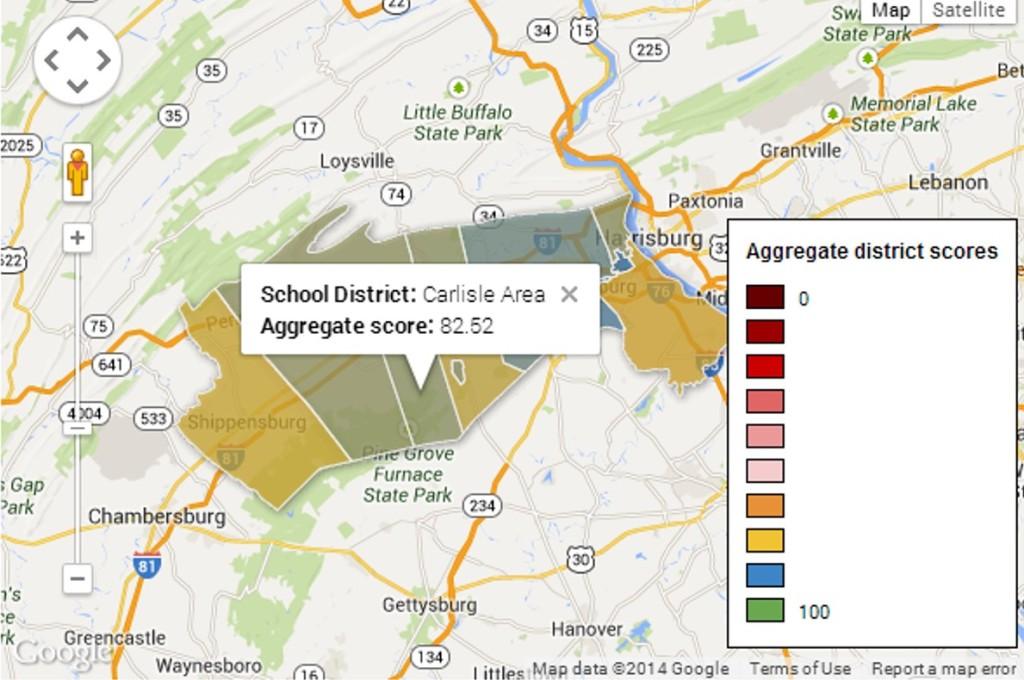
CASD as a whole received a building-level academic score of 82.52/100.
January 9, 2014
As the end of the semester nears, many students are beginning to worry about their grades. However, Carlisle High School is satisfied with their own report card, given by the Pennsylvania Department of Education last December.
New this year, the Pennsylvania Performance Profile rates high schools based on their Keystone Exam performance, graduation rate, and SAT performance, among other things. CHS received a total building level academic score of 80/100, which puts it well above the average score for the area. Scores of nearby schools varied greatly, from Camp Hill’s 93.9 to Shippensburg’s 56.6.
“Overall, I’m pretty proud of our score,” said CHS principal Jay Rauscher, who dismissed a faculty meeting early upon hearing the news to reward the teachers for their hard work. “The 80-89 range was where we’d hoped to be.”
Over 70 % of CHS students were found to be proficient in reading and 85.6% proficient in math, but just over 35% tested proficient on the Keystone biology exam. Students performed admirably on SAT and ACT tests—CHS received 100 % in the SAT/ACT College Ready Benchmark category.
However, Rauscher mentioned that “Ultimately, [improvement] is our goal. [A total score of] 80 is a great starting point, but we want to see it go higher.”
To ensure that this happens, a school improvement plan is put into place every year to address CHS’s weaknesses. This plan used to focus on improving PSSA results, but the new Profile allows for data that helps the high school to work on improving more than just test scores.
“The School Performance Profile is a tremendous improvement over the PSSA system,” said Rauscher. “It really looks at the whole picture.”
The “whole picture” of CHS depends on even more than school ratings.
“Our mission statement as a school…focuses on the needs of Carlisle specifically, taking into account the population and the characteristics of the student body,” said CASD teacher Julie Brent. “[What makes a good school] is to recognize those characteristics and to implement strategies focused on meeting our specific needs.”
On its website, the Pennsylvania Department of Education stated that, “The [overall] score for a school is based upon indicators that define a high performing school.”
Carlisle High School, it seems, is defined as even more than such.
For more information, visit http://paschoolperformance.org/Profile/5562.


Caitlin.Dull • Jan 22, 2014 at 9:59 am
Hmm…I don’t know if a low B is something to be proud of in general, but considering the number of students who just don’t care enough to try in the district, this is pretty good. I just wish we weren’t all so focused on the grades and teaching to the standardized tests. We aren’t learning anymore. Just cramming. But hey…Great article.
Amelia Winn • Jan 21, 2014 at 6:30 pm
Way to go CHS! I think it’s great that Carlisle High School is graded and compared to other schools. Nobody likes taking Keystones or the SAT, but it’s great that student scores can be used for both personal academic records and for the school (instead of there being another testing system/evaluation for students solely for the purpose of school evaluation).
Zach Mitchiner • Jan 15, 2014 at 2:21 pm
I agree with the grade that our school received from the department of education. I found the statistics that the organization offered, such as the academic level of 80 out of 100. I am not sure of the score we received last year, however I believe that the school should still be satisfied with the score no matter what, especially when compared to that of Shippensburg. The school improvement plan will undoubtedly help to increase our score by the time next year’s evaluation comes around.
William Morris • Jan 13, 2014 at 10:44 pm
Great Article! This really exposes some of the statistics of the school that students don’t typically get to see. This new system seems to be a big turnaround in our educational evaluations. I know that serious budget cuts were going to come under the old regime as a result of our school not being able to score high enough on PSSA’s, but based off of what this article says, things are starting to look better.
A suggestion that I might make is to elaborate a bit more on what the “whole picture,” from the fourth-to-last paragraph, means. Does it look at socioeconomic standings in the area? Is the average student home income being associated with the grade of the school, or with individual grades on the test per student’s home income. I’d love to hear more!